
In this class, I am going to introduce logarithms multiple times, in multiple different ways. Most of these ways of seeing logarithms have a central property in common:
Logarithms transform multiplication into addition.
I’ll have a lot more to say about this as the course progresses. Keep this in the back of your mind as we start on this first version.
Counting zeroes
This first version is the easiest. The logarithm just counts zeroes. So, the log of the number 1000 is 3, because the number 1000 has 3 zeroes.
We write this:


- and so on!
And that’s it!
Well, no, not entirely it. There are probably two questions that occur to you at this point. For one thing, what if the number isn’t a nice round number like 1,000,000, but something more like 31,648? And secondly, what is the value of doing such a simple-minded thing in the first place?
I’ll try to start answering the first question now. The second question will be answered gradually throughout the class, but I’ll give a teaser at the end of the post.
How to interpolate log
So, what should the log of a number like 32 be?
There are many different answers you could give to this question. You could say log(32) just isn’t defined: log(10)=1, and log(100)=2, but the number 32 has no zeroes. You could alternately say that the log of every number from 10 up through 99 is equal to 1, and then it jumps to 2 when you get to log(100). So by that reasoning, log(32) would equal 1.
So, there isn’t just one answer to what log(32) should be. But I’m going to try to find an answer that makes the most “sense” (where “sense” is a bit subjective!). This is a question of “interpolation”: how do I fill in the missing values of log continuously?
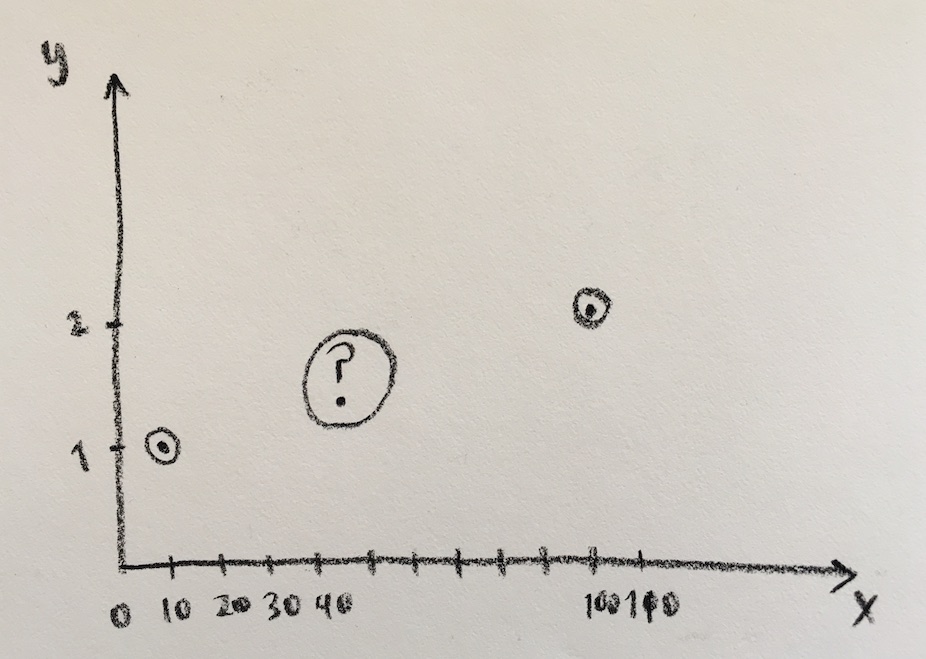
Since log(10)=1 and log(100)=2, and since the logs are getting bigger as the number gets bigger, I’d like to say that log(32) should be a decimal number between 1 and 2.
Moreover, I’d like to say that for all numbers x between 10 and 100, the value of log(x) is between 1 and 2, and that it gets bigger as x gets bigger. So, log (15) should be pretty close to 1, and log(95) should be pretty close to 2. But how do I fill in the numbers exactly?
I could fill them in proportionally. For example, since 55 is halfway between 10 and 100, I could say log(55) should be halfway between 1 and 2. That would mean l0g(55)=1.5. I could figure out other logs similarly. But this procedure ends up not making as much “sense” as I would like. In particular, if I make this definition, I end up getting a graph for log(x) that has straight line segments connected by sharp corners – a sign that something is weird.
Let me try asking a different question: what is a half a zero?
Multiplying numbers adds the zeroes
What would be a number with one and a half zeroes? Would it look something like this?

Well, look at what happens when we multiply multiples of 10. For example, if we multiply 100 x 10,000 we get 1,000,000: two zeroes plus four zeroes equals 6 zeroes. Multiplying the numbers adds the number of zeroes.

So if we multiply a number with one and half zeroes by itself, the two half-zeroes should combine to make a whole zero, and we should get three zeroes in total:

That is, multiplying a number with 1.5 zeroes times a number with 1.5 zeroes should give 3 zeroes total.
Now, what is such a number? It is a number that multiplies by itself to give you 1000? What could that number be? Well, we can start guessing and checking:
- 30 x 30 = 900
- 31 x 31 = 961
- 32 x 32 = 1024
- 31.5 x 31.5 = 992.25
So, a number with one and a half zeroes is a little bigger than 31.5.
Problem 1: find this number more accurately!
(If you recall your math, this number has a name: it’s the square root of 1000. But it’s instructive to find it by guess and check nevertheless.)
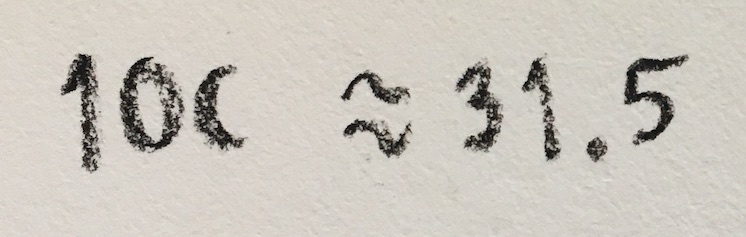
So now we’ve figured out something about logs! Since log(10)=1, and log(100)=2, and since one and a half zeroes is about 31.5, we have concluded that

Working even more approximately (which I want to do for now), we could say that

Another way of saying this: halfway between 10 and 100 is 55 in the additive sense, because
10+45=55, and 55+45=100.
But halfway between 10 and 100 is about 31.5 in the multiplicative sense, because
10 x 3.15= 31.5, and 31.5 x 3.15 = 100.
More roughly speaking, halfway between 10 and 100 is about 30, in the multiplicative sense.
What is this good for?
Before I develop this further, what is the point of this? I’ll try to give a number of different answers in this class. Here’s one which is unfortunately very relevant right now:
In the initial stages of a spreading infection, we expect the number of cases to grow multiplicatively: one person infects two, those two each infect two, those four each infect two… So we expect the number of cases to be multiplied by a certain fixed factor each day. Or said differently, we expect the number of cases to double in a fixed number of days. This is what the phrase exponential growth means.
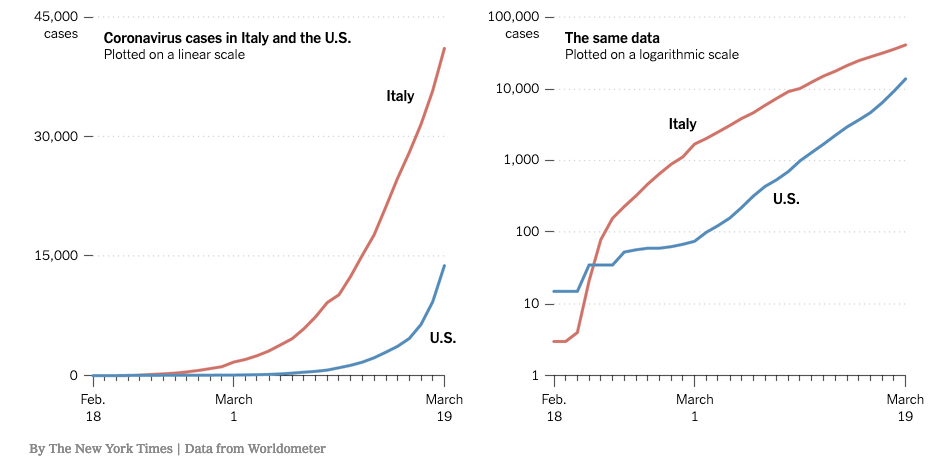
It is difficult to read rate of growth clearly on a graph when it is exponential: it shoots up too fast. But there is another way of graphing. On the y-axis, we have always been taught to space the labels evenly. That is what happens on the graph at left: each spacing is 15,000 additional cases.
But that is spacing evenly additively. What if we space evenly multiplicatively? Then each marking on the y axis should be a constant multiple of the last one. That’s what is shown on the graph at right: each equally spaced marking on the y axis is 10 times the previous one.
In other words, the y-axis is evenly spaced, counting the number of zeroes: the lines are 1 zero, 2 zeroes, 3 zeroes, etc. In yet other words, the y-axis is showing the logarithm of the number of cases.
On such a graph, an exponential growth is going to be a straight line. (We will see exactly why this is true soon, but hopefully that seems at least plausible to you now.) So we can more easily see deviations from exponential growth. We can see that, as of mid-March, Italy was beginning to succeed at “bending the curve”, whereas the US was not successful at this yet. This is not evident from the graph at left.
I encourage you to read the article I took this graph from. (I believe this article should be free to access, but let me know if not, and I’ll send you a copy.) You can see more detail for different countries at this Financial Times article by Steven Bernard, Cale Tilford, John Burn-Murdoch and Keith Fray.
To connect this to what we started above: if we added more markings to the graph on the right, we would make the multiplicatively evenly spaced. So if we wanted to add an additional marking halfway between 10 and 100, it should be marked about 31.5.
Some questions
Problem 2: What number has a half a zero? In other words, what number x has log(x) = 0.5?
(You can just give an approximate answer.)
Problem 3: Roughly, what is the value of log(3)?
Problem 4: Roughly, what is the value of log(30,000)?
(Hint: Use the fact that 30,000 = 3 x 10,000.)
Please ask questions or discuss, either in the comments here, or on our Slack channel!